preview 0.0.7

A guide that turns house physics, bills and comfort into plain language.

Interactive home energy guide

House in Balance

An interactive guide to how form, glazing, the building envelope, shading and use shape bills, winter comfort and summer overheating.

same total conditioned floor area, different standard quick view or deeper read model location: north of Lake Como
Start here

Watch the guide in one clear pass

This walkthrough is about how to use this page: compare the same house, stay in quick mode first, then go deeper only when you want the why.

This walkthrough is about how to use this page. If you need the building-science basics behind terms like airtightness, thermal bridges, or MVHR, the principles video lower on the page is the better next step.

  • Keep the same total conditioned floor area and climate.
  • Change one scenario or one slider.
  • Read the bill, winter comfort, and summer risk together.

Same house, different standard

Set the total conditioned floor area and today's bill. Then switch the same house between weaker and stronger standards.

location: north of Lake Como EU framework + Italian APE

Approximate conversion based on ECB reference rates.

Keep fixed 140 m² · same climate Same total conditioned floor area and the same climate.
Change house standard Selected version against the Lake house benchmark.
Starting bill starting amount for comparison Only the comparison anchor, not the energy class.
Your current bill 220 EUR/mo. The amount that anchors the comparison.
The same house in this version 220 EUR/mo. An indicative translation for the same area and climate.

Same benchmark, two ways to read it

House keeps the number in winter kWh/(m²a). Car turns the same winter gap into a small-car analogy. Bills and the Italian listing label stay in their own rows below.

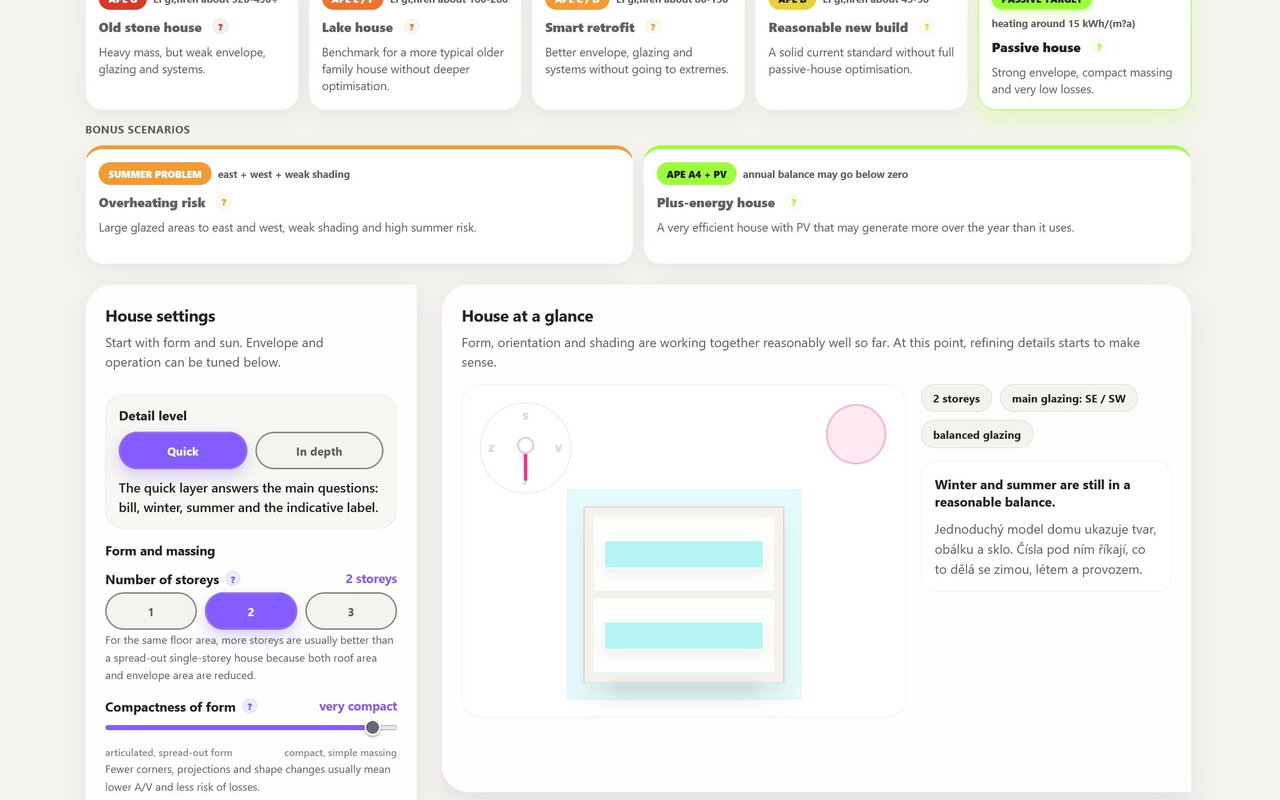
The fixed benchmark is the Lake house with the same total conditioned floor area and climate.

Optimized passive220 EUR/monthsame house · 140 m² · same climate

I compare the selected version with the Lake house of the same size and climate.

Running cost is translated through an indicative energy price by system type.

I also estimate delivered energy and relative operating pressure.

House appetite

Optimized passive15.0 kWh/(m²a)same house · 140 m² · same climate

Compared with the Lake house, this version needs far less heating energy to get through the same winter.

For heating alone, this would read as a much smaller monthly slice than the Lake house benchmark.

House mode stays on winter heating demand, so Passive House near 15 and a reasonable new build near 45 still read correctly. Car mode turns that same winter-demand gap into a simple small-car analogy, while the bought heating energy and the Italian listing label stay below as separate layers.

Indicative label in the Italian market: loading.

One benchmark house, five standards

This row keeps the same north Lake Como benchmark house and only changes how well it is built and equipped.

Think of one 140 m² house in the same climate. The first four presets keep the same glazing logic; only the passive version gently shifts more glass to the south.

Bonus scenarios

House at a glance

Loading an indicative snapshot of the current version.

The quickest mental model

One simple map before the numbers start to get in the way.

Winter: heat losses vs heat gains

Losses through the envelope and air minus the useful gains from sun, people and use.

Summer: overheating vs protection

Solar gains and internal heat versus shading, night cooling and ventilation.

Operation: system and photovoltaics

They change net operation, cost and the label. They do not repair a weak envelope on their own.

What it means in money

220 EUR/mo.

Loading a simple operating-cost translation.

How demanding winter will be

0 kWh/(m²a)

Loading a simple winter reading.

How many summer hours may fall outside comfort

0 %

Loading a simple summer reading.

Why it ends up like this

Just three main reasons, without a technical breakdown.

    What I would tackle first

    Loading the biggest first lever.

    Loading a simple next move.

    Annual heating demand

    0

    0 kWh/year

    Peak heat load

    0

    how much peak power the house wants in a cold spell

    Share of summer hours outside comfort

    0

    estimated share of assessed summer hours above comfort

    Indicative APE / EPgl,nren

    0

    this is not the same quantity as annual heating demand

    PV generation

    0

    0 kWh/year from photovoltaics

    Net primary after PV

    0

    the wider operating layer after systems and photovoltaics

    Form and A/V

    Loading the link between storeys and heat-loss area.

    Orientation and glazing

    Loading the effect of solar orientation and glazing split.

    Summer without magic

    Loading the summer behaviour of the house.

    Winter: where the house loses heat and where it gains it

    Cyan shows where heat escapes. Magenta shows the heat sources that help the house in winter.

    Loading losses and gains.

    Summer: what heats the house up and what protects it from heat

    Magenta shows summer heat sources. Cyan shows protection, shading and cooling.

    Loading summer interactions.

    How the house is doing

    I show the Passive House threshold directly as the space-heating-demand criterion. The Italian APE label is read here only approximately via EPgl,nren and kept separate from heating demand.

    Heating demand

    Loading...

    Overheating

    Loading...

    Indicative label (IT)

    Loading...

    G F E D C B A1 A2 A3 A4
    How to read APE and EU labels without confusion

    On Italian listings you will often see the A4 to G scale. In general, the worse the label, the higher the operating cost and the weaker the energy standard of the house.

    This app therefore separates three different things: heating demand, resulting operation and the indicative market APE language. It is not a legal APE calculation or a replacement for a detailed design-stage calculation.

    What helps most

    Small simulated steps on top of your current setup.

    What this means

    Loading a readable summary of the current results.